WASHINGTON — Ever wonder when the weather reports include the average high and low temperature where those numbers come from? While D.C.'s records go back to 1871, NOAA, The National Oceanic and Atmospheric Administration, uses a moving average of 30 years as the basis for comparison and recalculates the 30 year average for daily high and low temperatures and precipitation at the beginning of every decade. So the latest 30 year average is from 1991 to 2020.
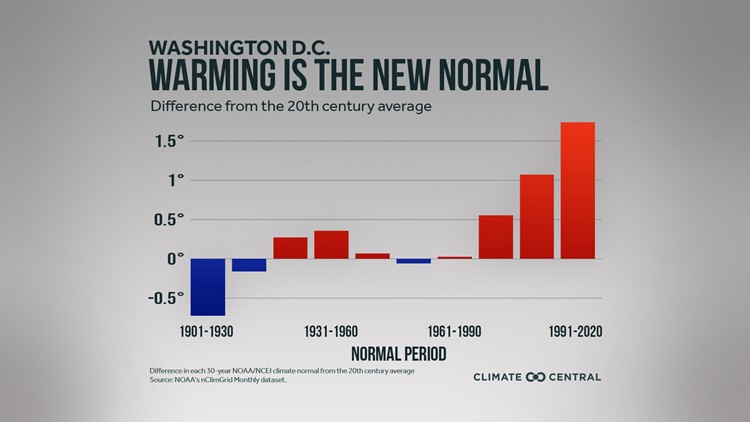
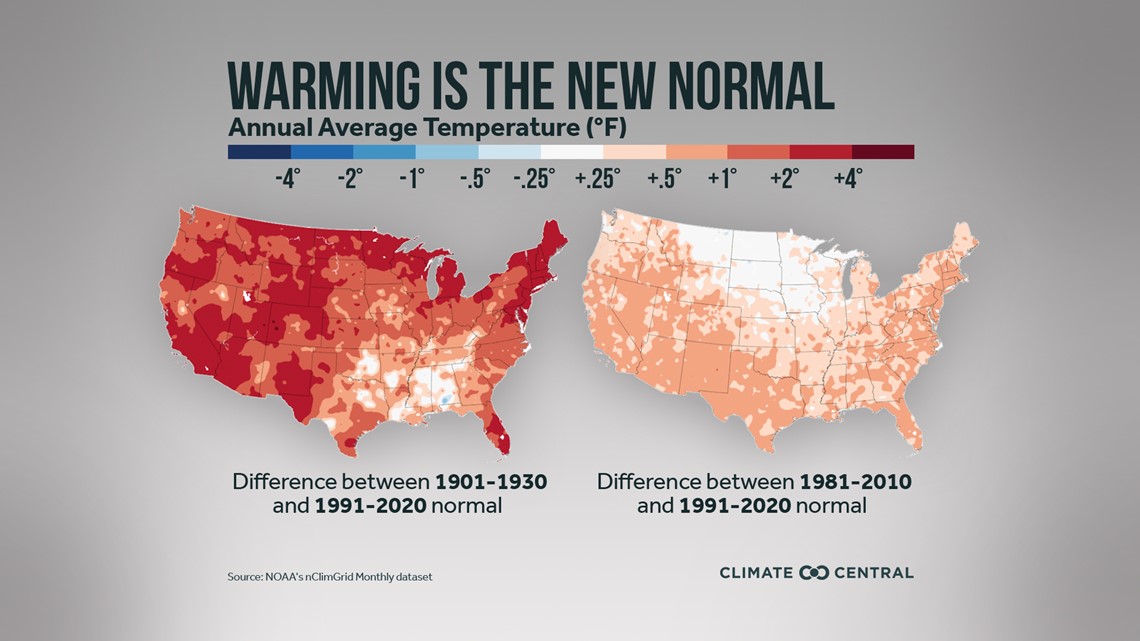
Profound Changes in “Average” Weather for the Nation’s Capital
For example, “average” weather statistics for the last decade were based on the 30-year period from 1981 – 2010. However, NOAA has updated its averages to reflect the period from 1991 – 2020. This resulted in major changes in the climate data, and revealed that the DC Metro Area was notably warmer and wetter.
The decade of the 2010s replaced the 1980s in NOAA’s updated data set as .the warmest on record. That’s significant because the 2010s were a much warmer period in the D.C. Metro Area. The increased urban heat island effect over the last decade can be attributed to several factors: a more developed downtown area; increased suburban sprawl; and a higher population density.


In addition, while the greenhouse effect of trapping the sun’s warmth in earth’s lower atmosphere is a naturally occurring process, it can be enhanced by human activities. For example, increased automobile and airline traffic produces more greenhouse gasses like carbon and sulfur dioxides. Also, the increased amount of suburban sprawl has reduced the tree canopy and amount of vegetation that has traditionally been the natural way the environment processed carbon dioxide. Some Washingtonians may recall how after driving not far north up I-270 or west on Route 66 that you would be in the countryside, but that’s not the case anymore.
The weather over the last decade has been notable since the Nation’s Capital had its warmest February (2017), March (2012), April (2017), May (2015), July (2011) and December (2015) during that time. There have been several other warm months in the last decade that ranked among the 'Top 5' warmest, like December 2020, which finished tied for fourth warmest on record. That has helped DC’s average annual temperature – combining daily high and low temperatures – to rise from 58.2° to 59.3°, according to NOAA.
One significant change in NOAA’s updated statistics is that Washington, D.C. now sees a daily average high temperature of 90° from July 7 – July 25. Previously, DC’s warmest average daily high temperature was 89° using the 30-year average from 1981 – 2010. Also, the Nation’s Capital used to average more than five weeks of daily low temperatures of 29° or colder. Now, there aren’t any such days in the updated statistics. That’s not to say there haven’t been some cold months in the Nation’s Capital such as March 2014, February 2015 or November 2019, which all finished at least 3.5° cooler than average, but the very cold weather has become much less frequent.

Not only has the D.C. Area become warmer in the last decade, but it’s also become wetter. While 2018 is D.C.’s wettest year on record, there have been some other notable trends over the last decade. Using the 1981 – 2010 data set, May was D.C.’s wettest month of the year with an average of 3.99”. However, June and July each now average over 4” of rain. There has also been an increased frequency in recent years for heavier single-day rainfall events. The Nation’s Capital has a record 24 days in 2018 when an inch or more rain occurred. Washingtonians also set a new record in 2020 for the highest number of days (seven) with at least 2” of rain.
Local winter weather enthusiasts may be disappointed, but not necessarily surprised, to learn that the Nation’s Capital officially averages less snowfall now with NOAA’s updated statistics. D.C. now averages 13.7” of annual snowfall, down from 15.4”. The only month that D.C. averages more snow now than it did previously is March, which saw an increase from 1.3” during the 1981-2010 average to 2.0” from 1991-2020. That’s largely the result of March being DC’s snowiest month of the year four times in the last decade, most notably in 2014 when a staggering total of 12.7” occurred. Dulles and BWI Airports also saw reductions in their average annual snowfall totals.
D.C.’s trend for warmer and wetter conditions is not unique as other major urban areas in the eastern United States have seen similar adjustments in NOAA’s updated statistics. That underscores the impact that the urban heat island effect has in combination with society’s overall impact on the changing climate. Higher greenhouse gas emissions enhance the urban heat island effect, as does the loss of green space through suburban sprawl and population growth.
Related Links: